

The US Dollar in 2026: Navigating Cyclical Regimes Amid Persistent Global Dominance
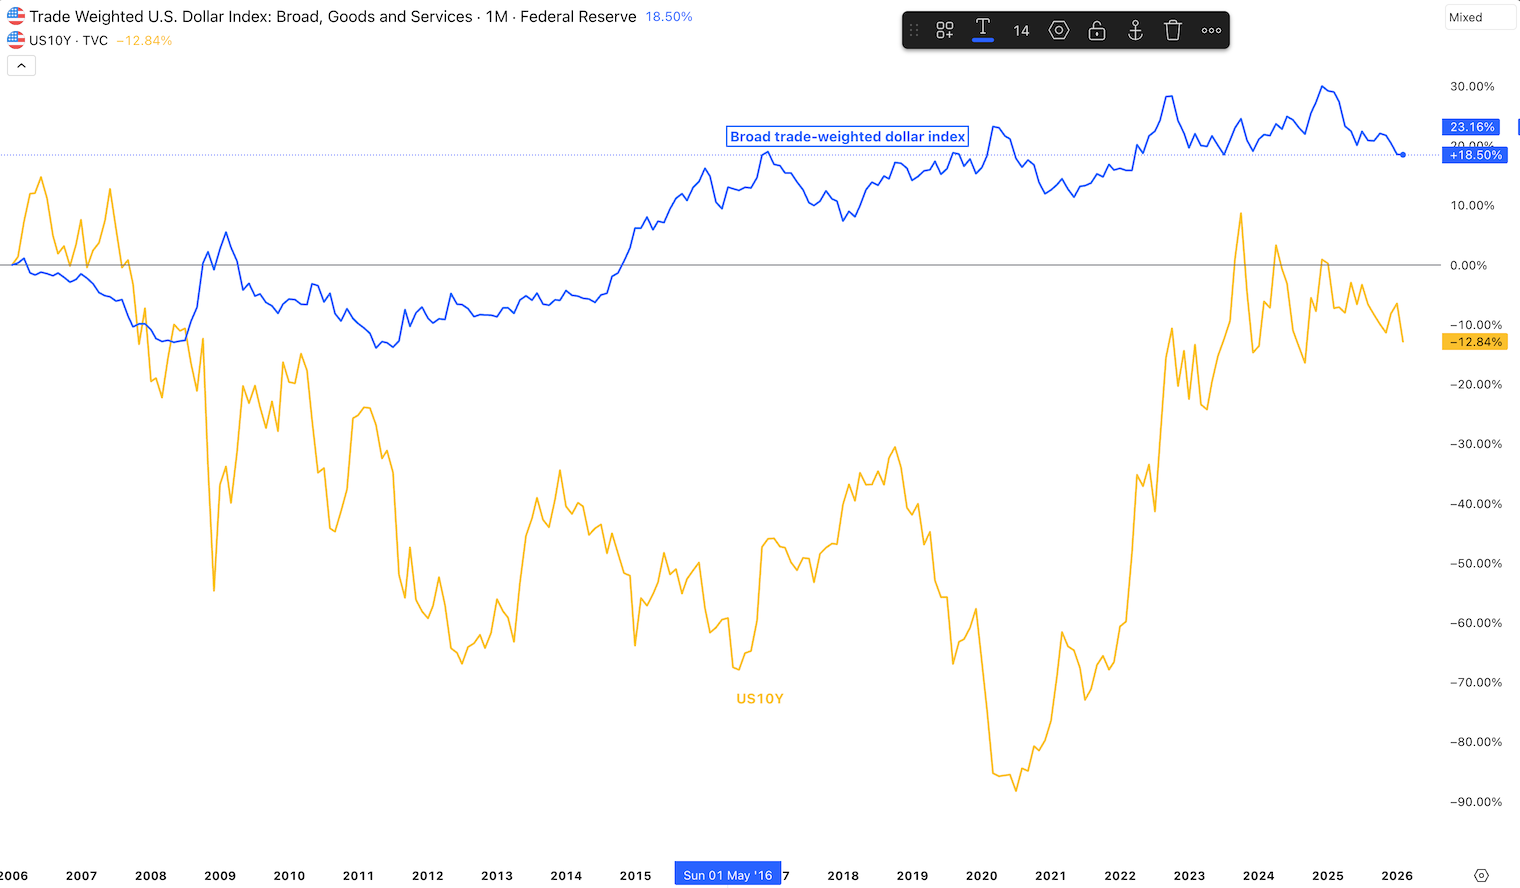
The US dollar (USD) remains the linchpin of the global financial system, serving as the primary reserve currency, a safe-haven asset, and the pricing benchmark for commodities and cross-border debt. Its value, most commonly tracked via the ICE US Dollar Index (DXY), which measures the greenback against a basket of six major currencies (euro, yen, pound, Canadian dollar, Swedish krona, and Swiss franc), stood at 97.61 as of February 27, 2026—down 9.27% year-over-year but up 1.24% over the past month on resilient US inflation and labor data. The Federal Reserve’s broad trade-weighted index (DTWEXBGS) was 117.99 as of February 20, 2026, reflecting a still-elevated but softening position against a wider set of trading partners.
This article examines the dollar’s historical patterns, its cyclical nature with supporting evidence, recent trends through early 2026, consensus forecasts for the next 12 months, and broader implications for investors, policy, and global markets. While structural factors like dollar dominance endure, the evidence strongly supports viewing the USD as a cyclical asset whose multi-year bull and bear regimes are driven by relative US economic performance, monetary policy differentials, and global risk sentiment.
Historical Analysis: Decades of Distinct Regimes Relevant to Today’s Transition
Since the end of the Bretton Woods system in 1971 and the advent of floating exchange rates in 1973, the dollar has exhibited prolonged periods of strength and weakness, typically lasting 8.7 years on average. These are not random fluctuations but regime shifts tied to macroeconomic fundamentals.
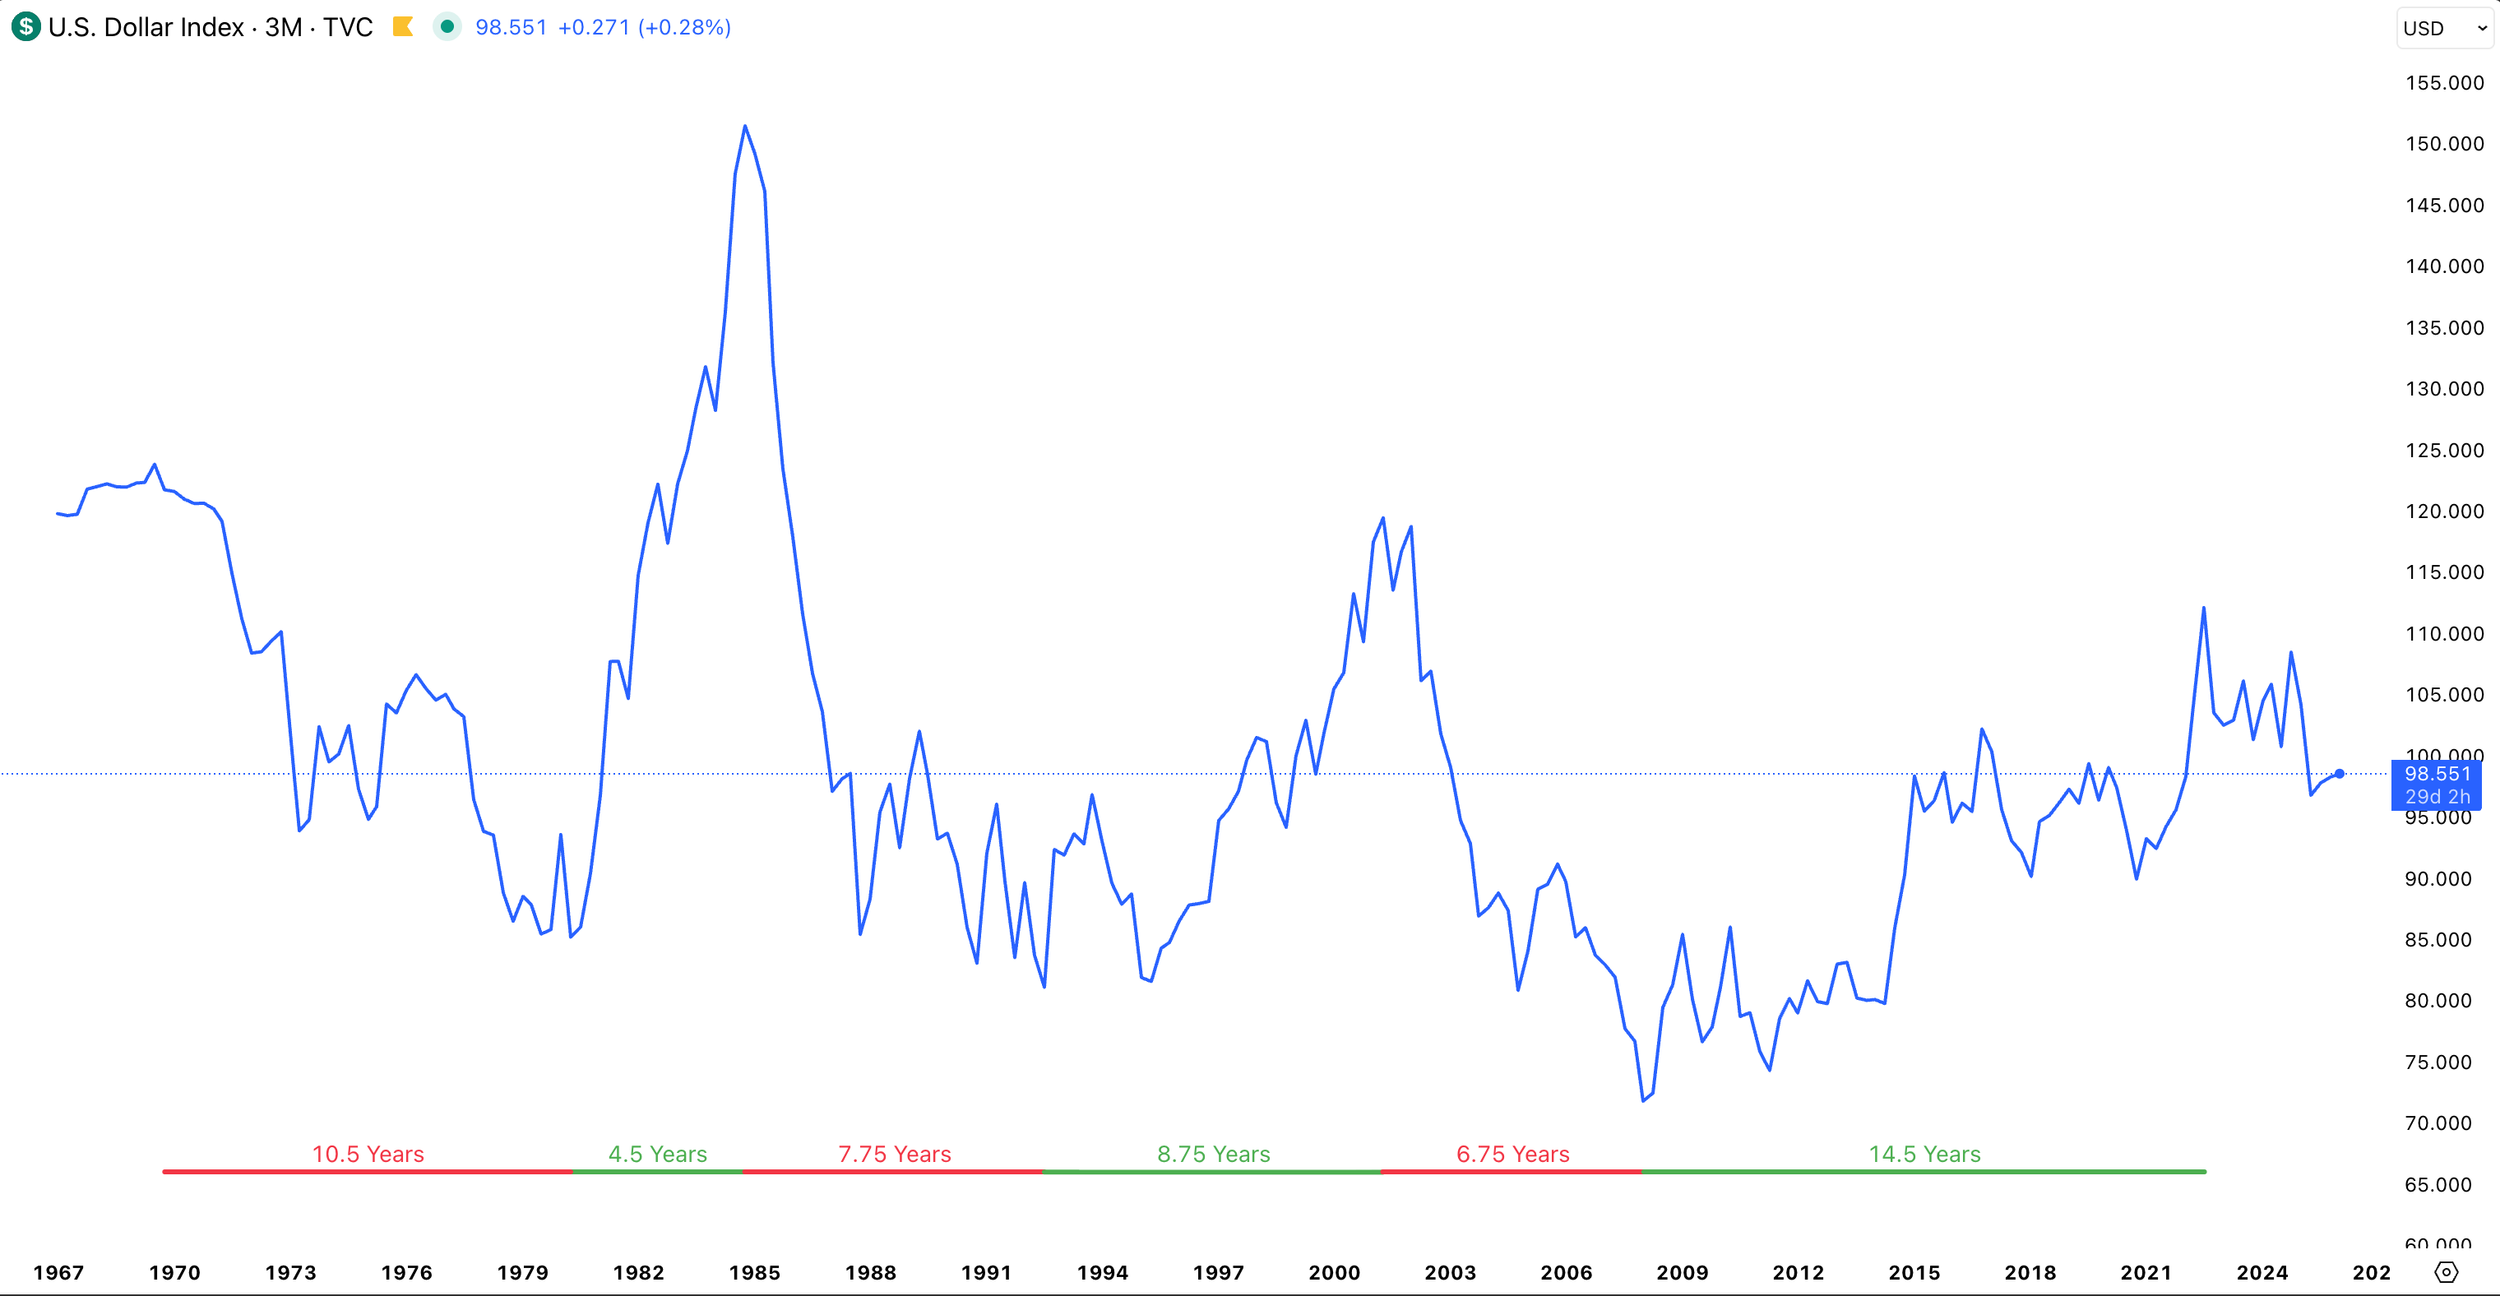
DXY periods of strength and weakness.
Key historical episodes include:
• The 1970s bear market (roughly 1971–1978), when high US inflation and loose policy led to a ~32% decline in the DXY, boosting commodities and non-US assets.
• The powerful 1980–1985 bull run (+96% peak), fueled by Federal Reserve Chair Paul Volcker’s aggressive rate hikes to combat inflation, which ended with the Plaza Accord as policymakers intervened to weaken the overvalued dollar.
• The 1985–1992 bear phase (~51% drop), followed by a 1992–2002 bull (~52% gain) amid US tech-led growth and the “strong dollar” policy under Treasury Secretary Robert Rubin.
• The 2002–2008 bear (~40% decline) during the housing boom and global carry-trade era.
• The extended post-GFC bull from March 2008 to September 2022 (+56%), driven by repeated safe-haven flows during crises (2008, 2011, 2020), US shale energy independence, and exceptional post-2021 rate hikes that widened yield differentials.
These cycles remain highly relevant in 2026. The 2008–2022 bull which was significanlty longer than the historical average at 14.5 years, reflected a combination of US growth outperformance, quantitative easing divergence, and the dollar’s safe-haven status during COVID-19 volatility and the 2022 inflation shock. The subsequent weakening, which accelerated in the first half of 2025 with an ~11% drop (the largest since 1973), mirrors classic bear-phase dynamics: narrowing interest-rate differentials as global central banks caught up or US exceptionalism faded, combined with capital reallocation toward higher-yielding or undervalued non-US assets.
Evidence That the Dollar Is a Cyclical Asset
The dollar qualifies as a cyclical asset because its value fluctuates systematically with the global business and financial cycles rather than drifting randomly or following a pure secular trend. Multiple independent lines of evidence from public data and research support this.
First, multi-year regime analysis demonstrates clear alternation between bull and bear phases averaging 9.25 years (bulls, +67% cumulative) and 8.3 years (bears, -41% cumulative). In bull phases, the S&P 500 has historically outperformed global ex-US equities (220% vs. 43% cumulative); in bear phases, the reverse holds sharply (90% vs. 140%) (RBC Wealth Management, November 2025, using data through September 2025).
Second, correlation with relative economic fundamentals: Stronger US growth or higher real yields relative to the rest of the world reliably drives appreciation. Historical overlays show the dollar rising during periods when US GDP growth outpaces the G10 average and falling when the gap narrows.
Third the dollar in relation to global liquidity: The nominal effective dollar exchange rate tracks a global financial-conditions index with a correlation of -0.54 since 2000. A stronger dollar coincides with tighter global liquidity, higher risk aversion (measured by the excess bond premium), and slower growth—especially in emerging-market and developing economies (EMDEs), where the correlation with output growth is -0.59 (2001–2021). A 10% dollar appreciation shock predicts a -1.5% trough in EMDE GDP after eight quarters, amplified by dollar-denominated debt burdens. This creates a self-reinforcing feedback loop: dollar strength tightens conditions abroad, prompting capital repatriation to the US, which further strengthens the dollar.
Fourth, safe-haven and risk-sentiment dynamics: In risk-off episodes (e.g., 2008, March 2020), the dollar surges as investors seek liquidity in the world’s deepest markets; in risk-on expansions, it weakens as capital flows outward. This counter-cyclical element in crises but pro-cyclical link to US relative strength makes it distinctly cyclical.
These patterns are observable in freely available FRED series (e.g., DTWEXBGS vs. US–G10 yield spreads or VIX) and contradict a purely structural narrative of inexorable decline. While gradual de-dollarization trends exist (e.g., slightly lower reserve share over decades), public IMF COFER data show the dollar’s share of allocated reserves hovering near 58–59% as of late 2025—stable over the cycle. Valuation models (PPP, BEER) often show the dollar as 10–15% overvalued at peaks, setting the stage for mean-reversion bears (consistent with BIS and Fed real effective exchange rate data).
In short, the evidence—drawn from decades of regime data, statistical correlations, and transmission mechanisms—confirms the dollar behaves cyclically, offering predictable (if imperfectly timed) opportunities for positioning across asset classes.
Recent Trends: From Post-2022 Peak to Early-2026 Stabilization
The dollar peaked near 114 in late 2022 amid the Federal Reserve’s aggressive tightening campaign, which created the widest US yield advantage in years. It then entered a multi-phase decline: gradual in 2023–early 2024 as other central banks hiked, then sharper in 2025 as US growth expectations moderated, rate-cut pricing accelerated, and investors rotated into international equities and bonds. The first half of 2025 alone saw an ~11% drop, marking the end of the long bull cycle that began around 2011.
In early 2026, the DXY has stabilized and even rebounded modestly month-to-month, trading in the 97–98 range. Drivers include hotter-than-expected January 2026 PPI (+0.5% m/m) reinforcing “higher for longer” expectations for Fed funds (currently 3.50%–3.75%), resilient jobless claims data, and speculation around potential tariff hikes that could support US growth and the currency. However, the 12-month trend remains decisively lower, with the broad index still reflecting a ~9% annualized softening.
Forecasts for the Next 12 Months
We project mild further net weakness in 2026, with the DXY likely trading in a 93–98 range and ending the year around 95–96, before potential stabilization or modest rebound in 2027 as differentials bottom.
The mild depreciation outlook stems from expected convergence in global growth rates, which historically correlates with dollar softening (e.g., -0.63 correlation with EMDE output growth over 1980–2021). IMF projections indicate global GDP expansion of 3.3% in 2026, outpacing anticipated U.S. growth around 2.0–2.5% based on recent BEA data showing Q3 2025 U.S. GDP at 2.1% annualized amid cooling consumer spending and investment. This narrowing gap reduces capital inflows to U.S. assets, as foreign economies—particularly in emerging markets recover from prior dollar-strength-induced slowdowns, where a 10% appreciation historically shaved 1.5% off EMDE GDP after two years via higher debt costs.
Interest rate differentials further underpin the forecast. The Federal Reserve's December 2025 dot plot median projects a modest 25 basis point reduction in the federal funds rate for 2026, potentially bringing it to 3.25–3.50% by year-end from current levels around 3.50–3.75%, assuming inflation moderates toward the 2% PCE target (projected at 2.4% for end-2026). This easing, combined with stable or rising yields in G10 peers (e.g., ECB and BoJ holding rates amid their own recoveries), could compress U.S.-G10 yield spreads from current levels near 1.5–2% (with U.S. 10-year Treasury at 4.0–4.05% as of March 2026), historically linked to 5–10% dollar declines per 1% the spread narrows. .
Potential upside risks to the dollar include stronger US data, delayed Fed cuts, or risk-off events that trigger safe-haven flows.
Volatility is expected to remain elevated due to policy uncertainty (tariffs, geopolitics including US-Iran talks) and the ongoing transition in the dollar cycle.
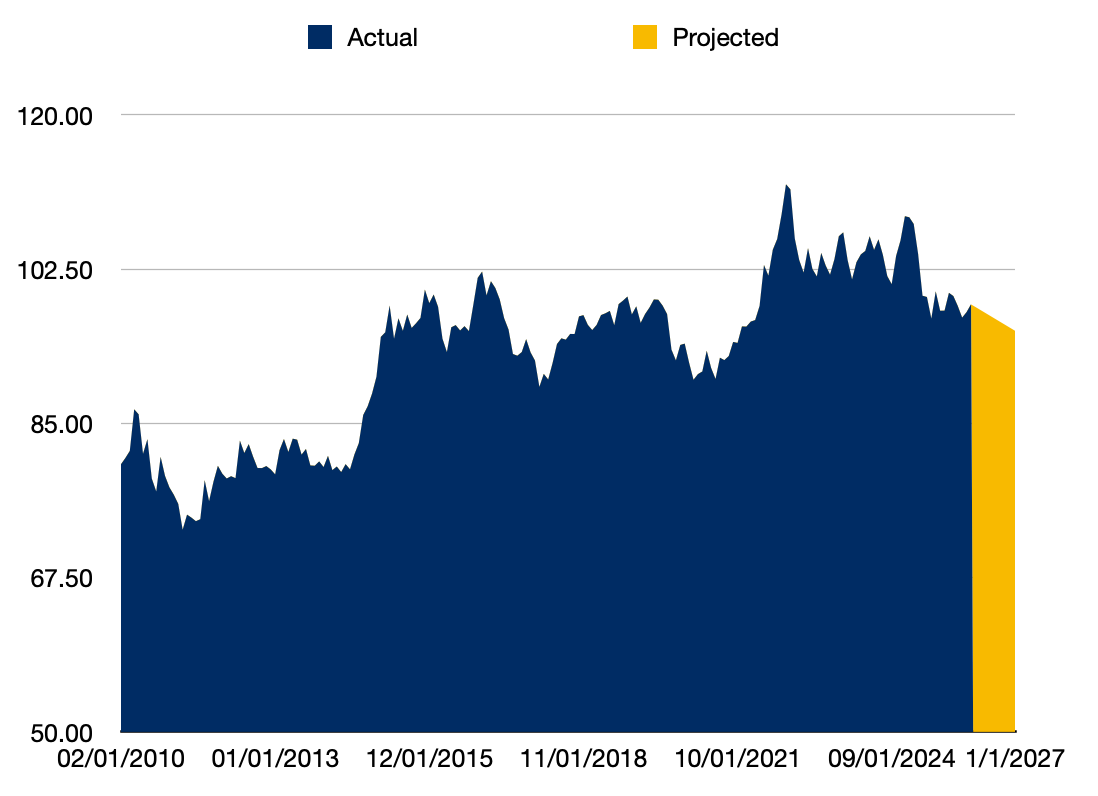
Projection for DXY leading into 2027
Broader Relevance: Investor Implications, Risks, and Enduring Dominance
A weaker dollar regime typically benefits US exporters (via competitiveness), commodity producers (as most are dollar-denominated), and emerging-market assets (lower debt-service costs, capital inflows). International equities have historically outperformed in bear phases. For carry-trade strategies, the dollar’s appeal as a high-carry funding or target currency has diminished as US–foreign rate spreads narrow, shifting opportunities toward higher-yielding EM currencies.
Risks include an abrupt reversal if US exceptionalism reasserts (e.g., via productivity surprises from AI or deregulation), disorderly unwinds if fiscal sustainability concerns escalate, or a structural acceleration of de-dollarization (though evidence suggests this remains gradual). The dollar’s liquidity, rule-of-law backing, and network effects ensure its reserve status persists even through cyclical weakness.
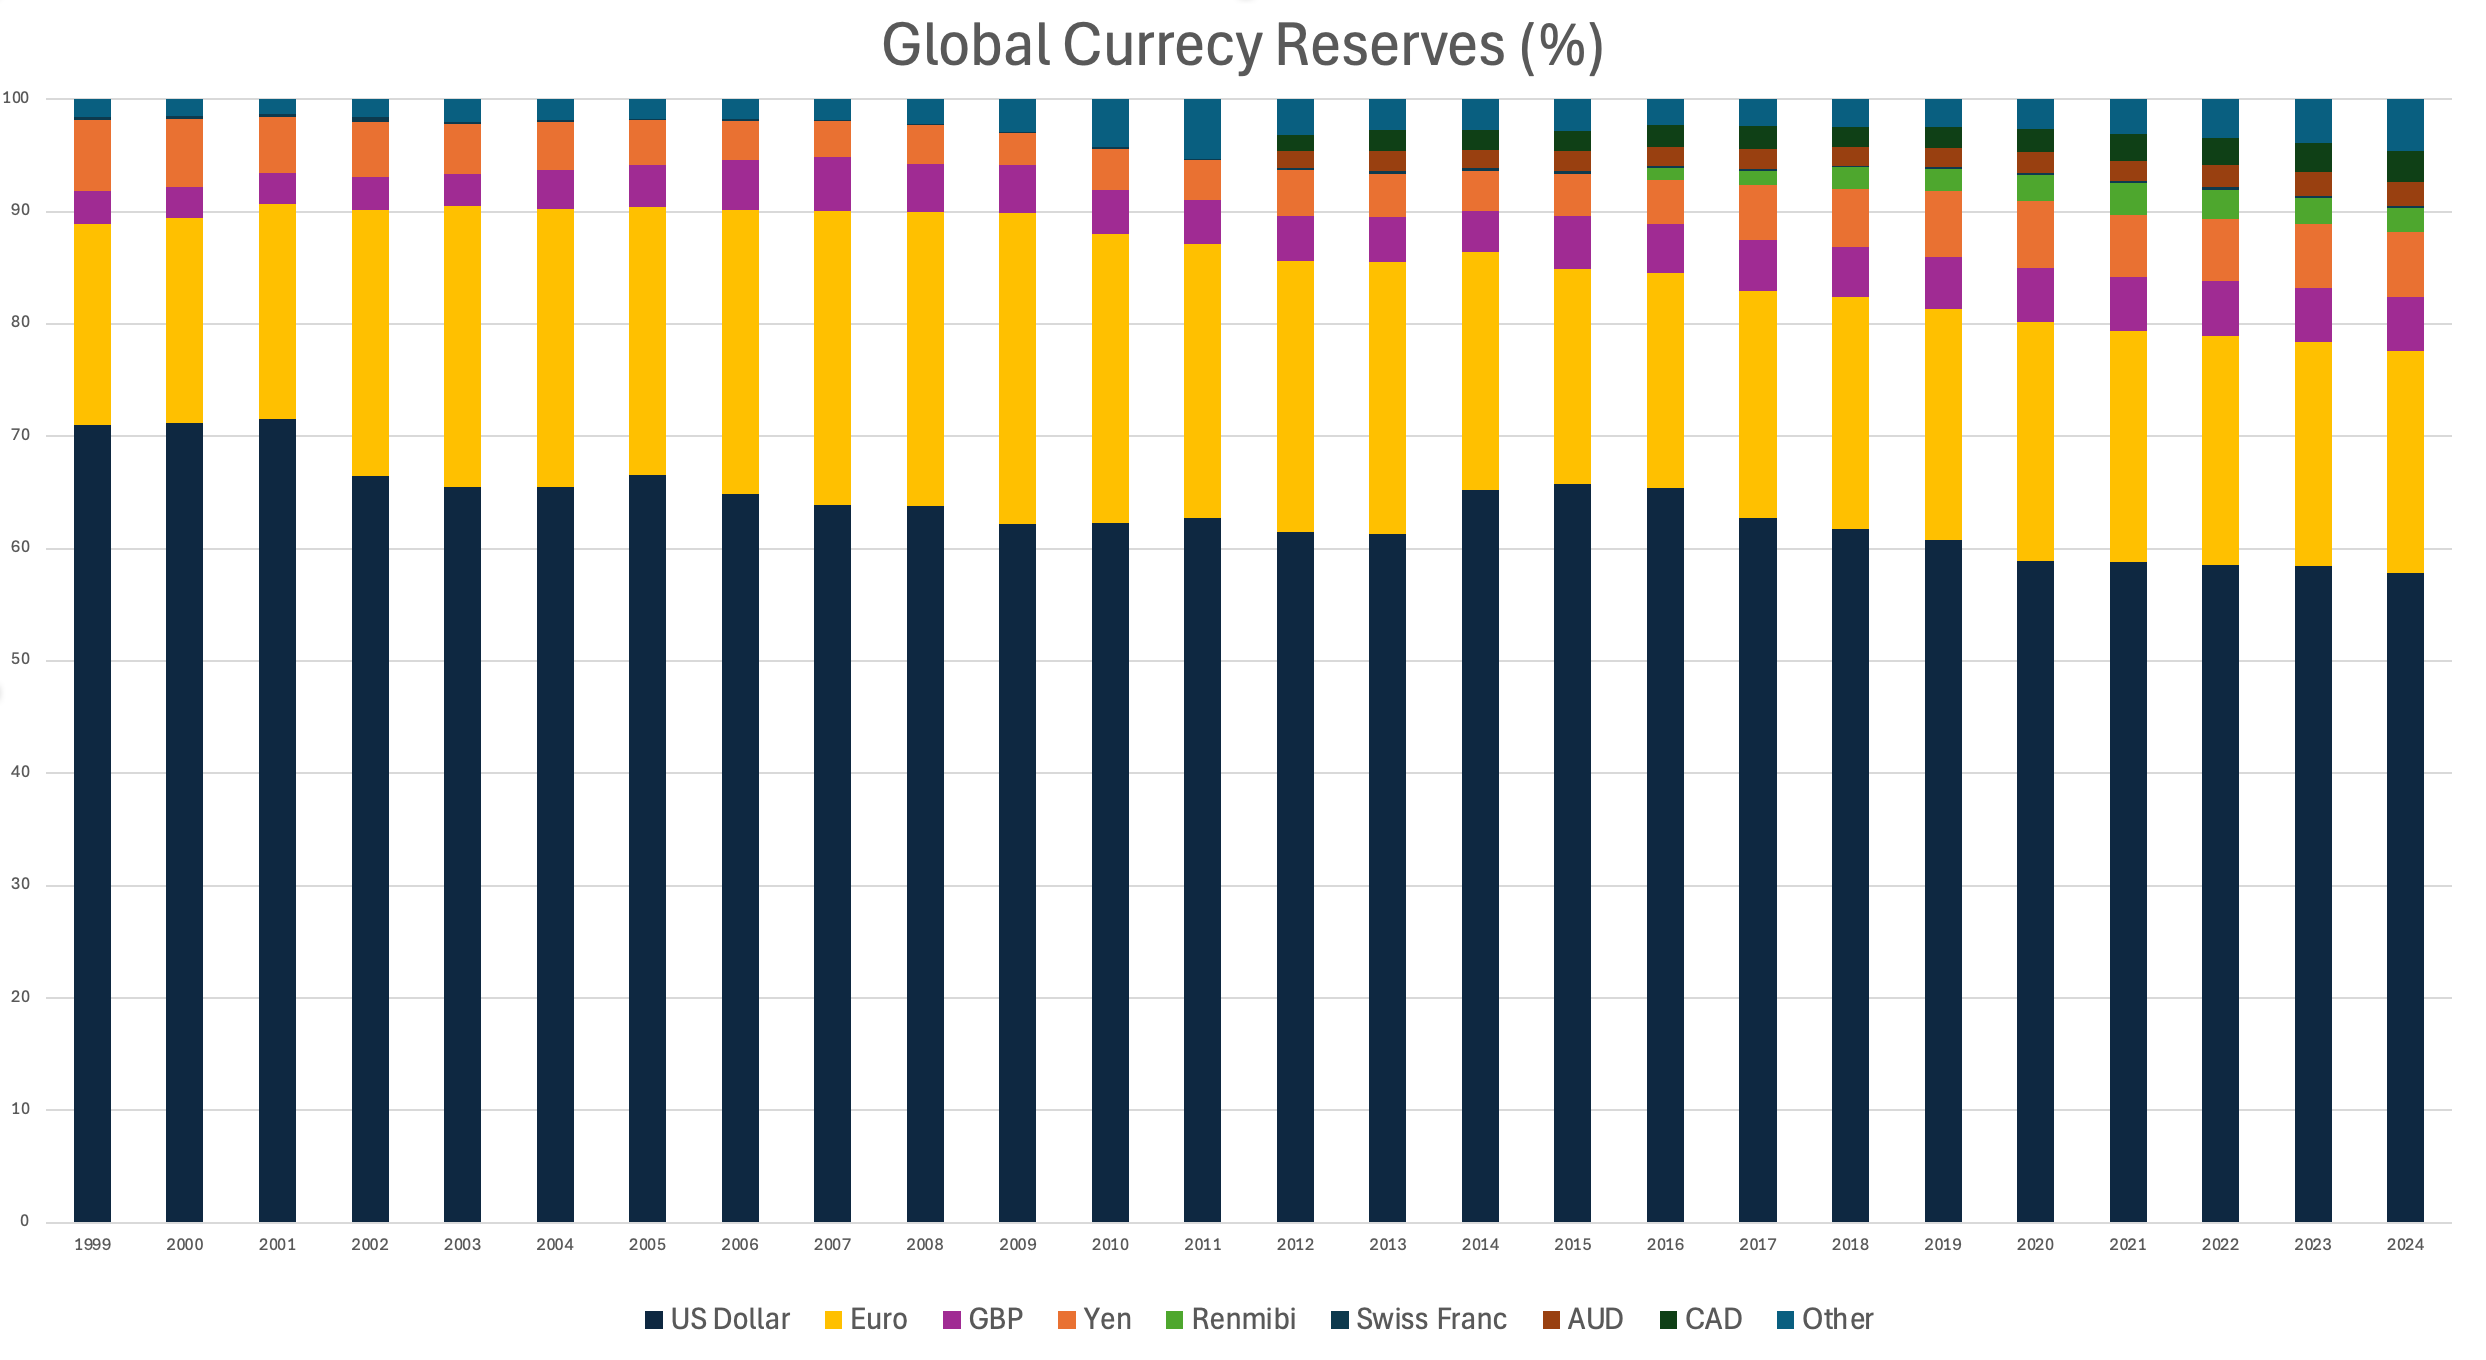
Source: COFER
Conclusion
The US dollar in early 2026 sits at the intersection of a maturing cyclical bear phase and structural resilience. Historical regimes, robust empirical correlations with global financial conditions and EM growth, and consistent regime-shift patterns provide compelling evidence that the dollar is indeed a cyclical asset offering tactical opportunities for diversified portfolios. While 2026 forecasts lean toward moderate further softening, monitoring Fed projections, relative growth data, and risk sentiment will be key. Investors should prepare for volatility but recognize that reports of the dollar’s demise remain, as ever, premature. The greenback’s dominance endures; its value, however, will continue to dance to the rhythm of the global cycle.