

The Energy Sector: Data Center Demand Boom Meets Iranian War Supply Shocks
As of March 2026, the global energy sector stands at a critical inflection point for investors. Surging electricity demand from AI-powered data centers is colliding with acute geopolitical supply risks stemming from the escalating war in Iran, including disruptions to the Strait of Hormuz. These dual forces are reshaping commodity prices, utility revenues, and broader macroeconomic outcomes. From a finance lens, this creates a bifurcated opportunity: upstream oil and gas producers stand to benefit from price spikes and risk premia, while utilities face a capex-driven growth cycle tempered by inflation pass-through challenges. Downstream, higher energy costs threaten to erode consumer spending and corporate margins, yet the scale of AI productivity gains far outweighs the drags.
The Data Center and AI Demand Explosion: Powering the Next Wave of Electricity Inflation
Global electricity demand is accelerating at its fastest pace in decades, with data centers and artificial intelligence emerging as the dominant structural driver, particularly in advanced economies. According to the IEA’s Electricity 2026 report, worldwide electricity consumption is projected to rise by an average of 1,100 TWh annually between 2026 and 2030 (reaching 33,600 TWh by 2030), and growing at 3.6% per year thereafter, significantly higher than the prior decade and at least 2.5 times faster than overall energy demand. Emerging markets and developing economies (led by China) will drive ~80% of the growth, but advanced economies are experiencing a resurgence after 15 years of stagnation, with data centers playing an outsized role.
In the United States, data centers alone are expected to account for roughly 50% of total electricity demand growth through 2030, adding over 420 TWh cumulatively and contributing nearly 2 percentage points to annual U.S. power demand growth. The European Union sees a similar pattern, with data centers fueling a significant share of the buildings sector’s 300 TWh increase. Data centers, currently ~7% of U.S. power demand, are expected to drive ~40% of total U.S. power demand growth over the next five years, adding 1.2 percentage points annually on average to overall demand (part of a 2.6% annualized total growth rate).
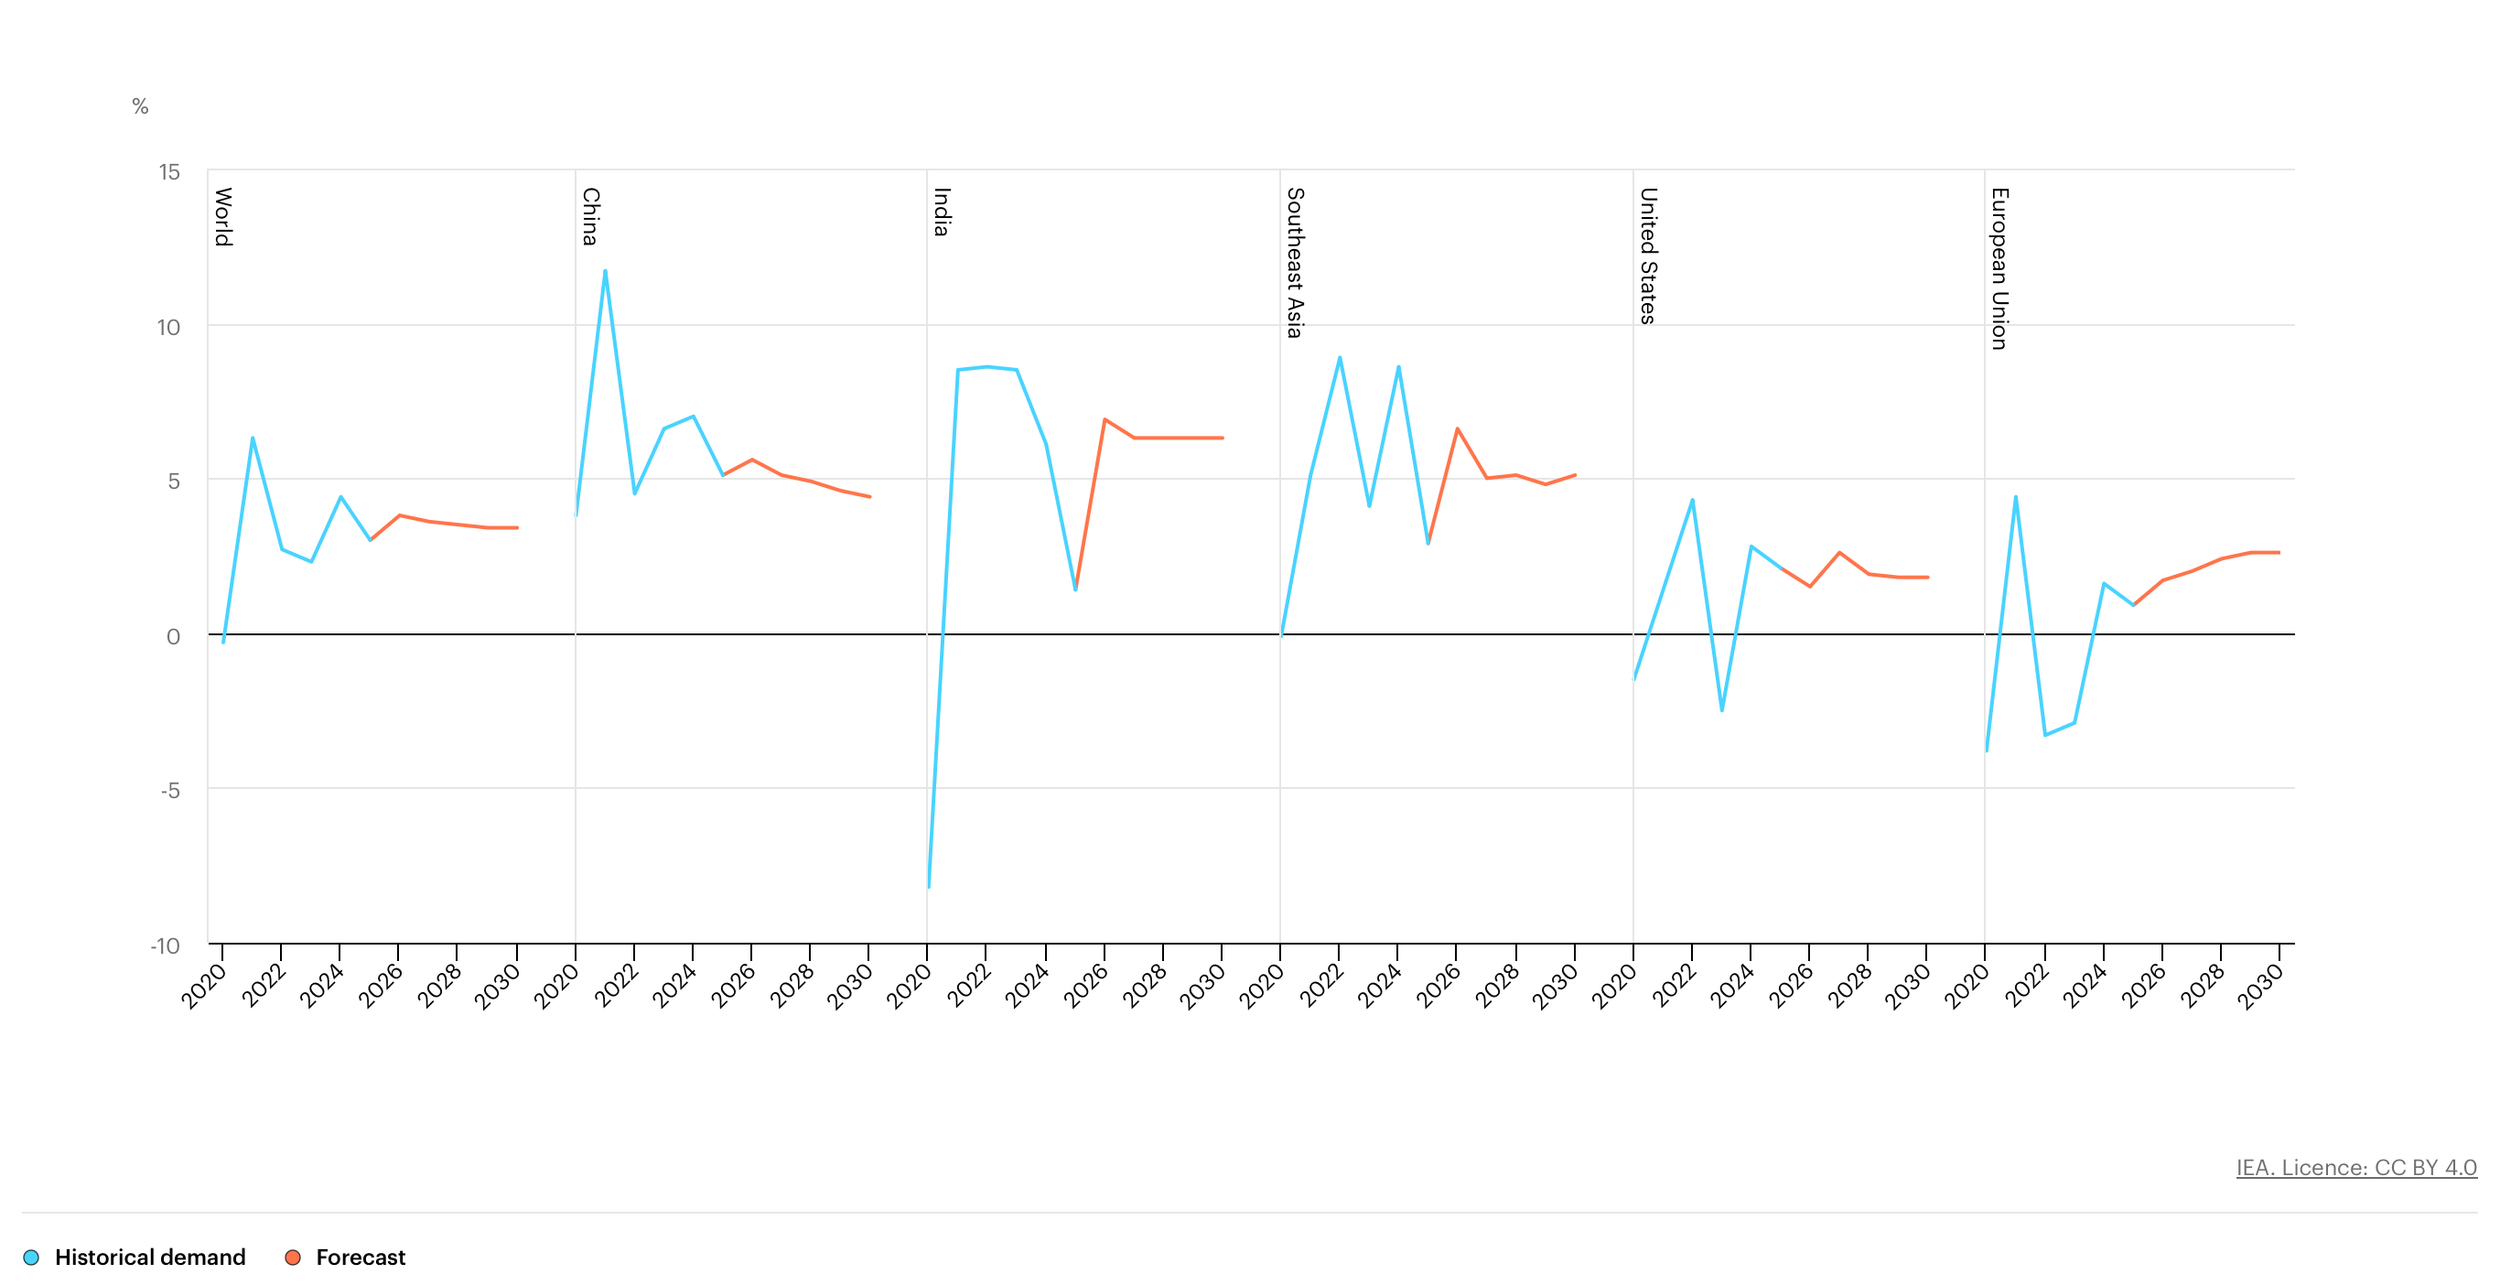
IEA: Year-on-year percent changes in electricity demand in selected regions, 2020-2030
Supply response lags badly. Regulatory approval times for new grid connections have stretched to a median 4.5 years (up from under 2 years in 2000), compounded by shortages of gas turbines, transformers, and skilled labor. Renewable additions are accelerating rapidly but remain intermittent. Accordi.ng to the EIA, developers plan a record 86 GW of new U.S. utility-scale generating capacity in 2026, with solar accounting for 51% (~43 GW) and wind 14% (~12 GW), plus ~24 GW of battery storage. This means renewables plus storage will provide virtually all net new capacity. Globally, the IEA projects renewable generation to grow by ~1,000 TWh annually through 2030 (8% yearly growth), with solar PV alone contributing over 600 TWh. We expect wholesale power prices to rise sharply in tight markets as spare capacity shrinks.
From our perspective, this is a boon for regulated utilities. Higher capex translates into rate-base growth and allowed returns, supporting dividends in the sector. However, the cost is being passed through: consumer electricity inflation is running at 6.9% year-over-year through December 2025 (versus 2.9% headline PCE), and we forecast it to hold near 6% in 2026–2027 before easing to ~3–3.5% in 2028 on softer natural gas prices.
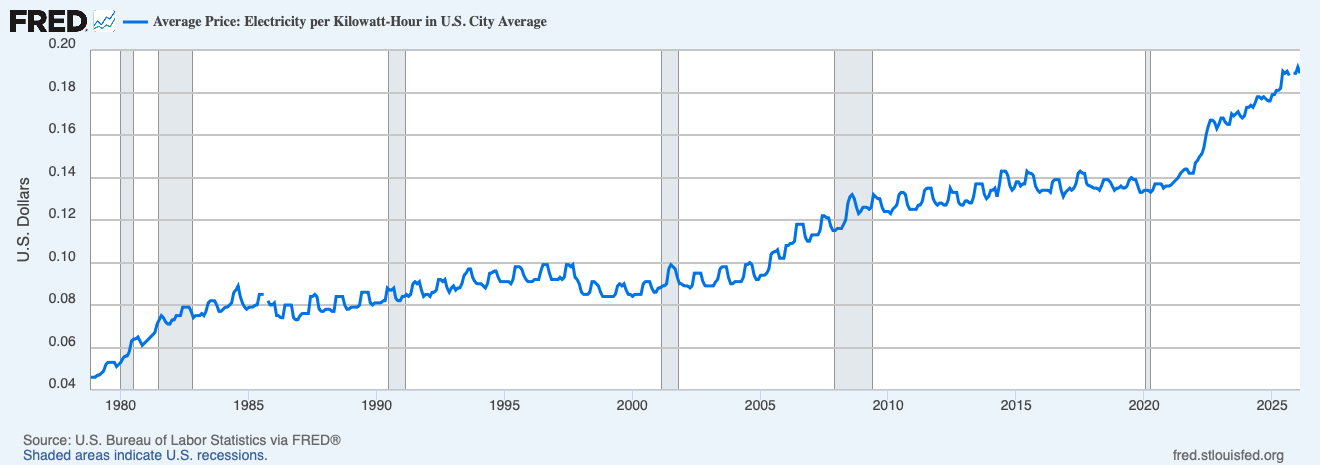
FRED energy price per KWH.
Overlaying this demand surge is the March 2026 escalation in Iran: Israeli and U.S. military actions led to the death of Supreme Leader Ayatollah Ali Khamenei, prompting Iranian retaliatory missile and drone strikes across the region. Tanker traffic through the Strait of Hormuz (carrying ~20% of global oil and 19% of LNG) has been severely disrupted. Three tankers damaged, precautionary halts by shippers, and reports of explosions (e.g., at Iran’s Kharg Island terminal) have already embedded significant risk premia.
Iran itself produces ~3.5 mb/d crude plus condensate (4% of global supply) and exports heavily via the Strait (13.4 mb/d crude average in 2025 across key Gulf exporters). A full closure puts ~16 mb/d net oil at risk after pipeline offsets (~4.2 mb/d). LNG risk centers on Qatar’s 80 mtpa flows. We estimate an immediate $18/bbl real-time risk premium in crude (98th percentile historically), pricing in roughly a one-month full halt or a 2.3 mb/d one-year disruption. Natural gas markets show smaller initial premia, but a one-month LNG halt could send European TTF prices to €74/MWh ($25/mmBtu), 130% above current levels.
The EIA’s March 2026 STEO (released March 10) explicitly incorporates these risks, revising Brent crude forecasts sharply higher: $79/bbl average in 2026 (up 37% from the prior outlook) and $64/bbl in 2027. Current spot Brent sits near $98/bbl (as of March), and is expected to stay above $95/bbl short-term before easing. U.S. crude production edges up modestly to 13.6 mb/d in 2026, aided by higher prices incentivizing shale output.
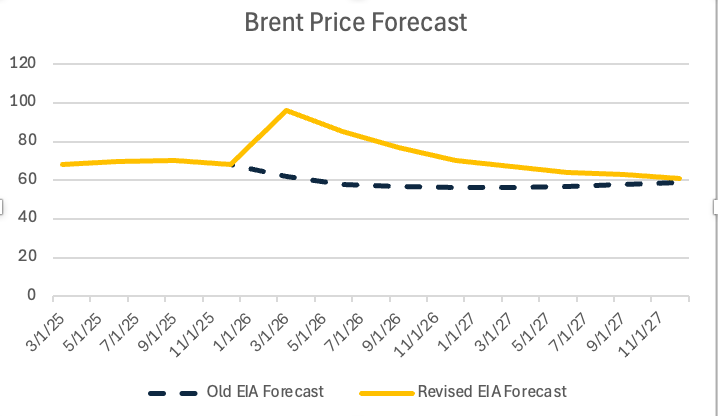
EIA Brent forecast
Price Transmission: Oil, Gas, Electricity, and the Interplay
The convergence is potent. Data-center demand lifts natural gas and power needs (U.S. generation mix in 2026: 40% natural gas, 16% coal, 18% nuclear, with wind/solar approaching 20% combined and total renewables nearing 25%), while Iranian disruptions spike oil and risk LNG. EIA Henry Hub natural gas averages $3.76/MMBtu in 2026 (down from near-term winter spikes of $7.72/MMBtu in January 2026 due to Winter Storm Fern), but war-related LNG risks could push European prices far higher. Retail gasoline and diesel are forecast up 14.7% and 20.1% respectively in 2026.
It should be noted the shock is mostly limited to energy, muting second-round effects versus 2021–2022, non-energy trade exposure to the Gulf is <1% of global trade, and chemical/metal price spikes (e.g. 25% in methanol) add at most 0.1 percentage points to global inflation. Still, expected global GDP growth is closer to 2.6% (down from 2.9%) and lifts headline inflation to 2.9% Q4/Q4, with oil alone shaving 0.3% off GDP and adding 0.5–0.6 percentage points to inflation. Central banks have responded: front-end rates have sold off, pricing in +40 basis points higher end-2026 policy rates in the U.S.
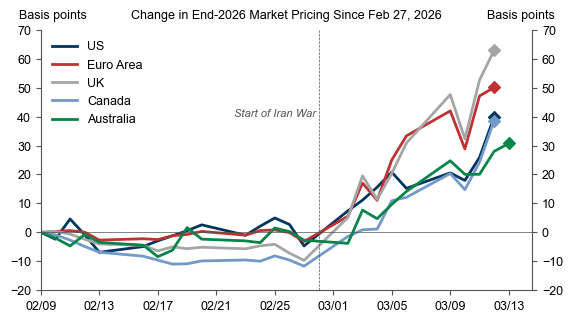
Front end rate data.
Renewables: Rapid Growth Amid Intermittency and Opportunity
Renewables are performing strongly and occupy a growing place in the market as the primary response to the structural demand surge. In 2025 wind and solar already supplied a record 19% of U.S. net generation (utility-scale + small-scale solar). With the massive 2026 capacity pipeline, that share is on track to reach ~21% by 2027 and total renewables (including hydro and biomass) are forecast by the EIA to hit 25% in 2026 and 27% in 2027. Corporate power purchase agreements from hyperscalers have become a dominant financing mechanism with nearly half of all global corporate clean-energy procurement in 2025 came from data-center operators locking in long-term renewable supply to meet sustainability and hedging goals.
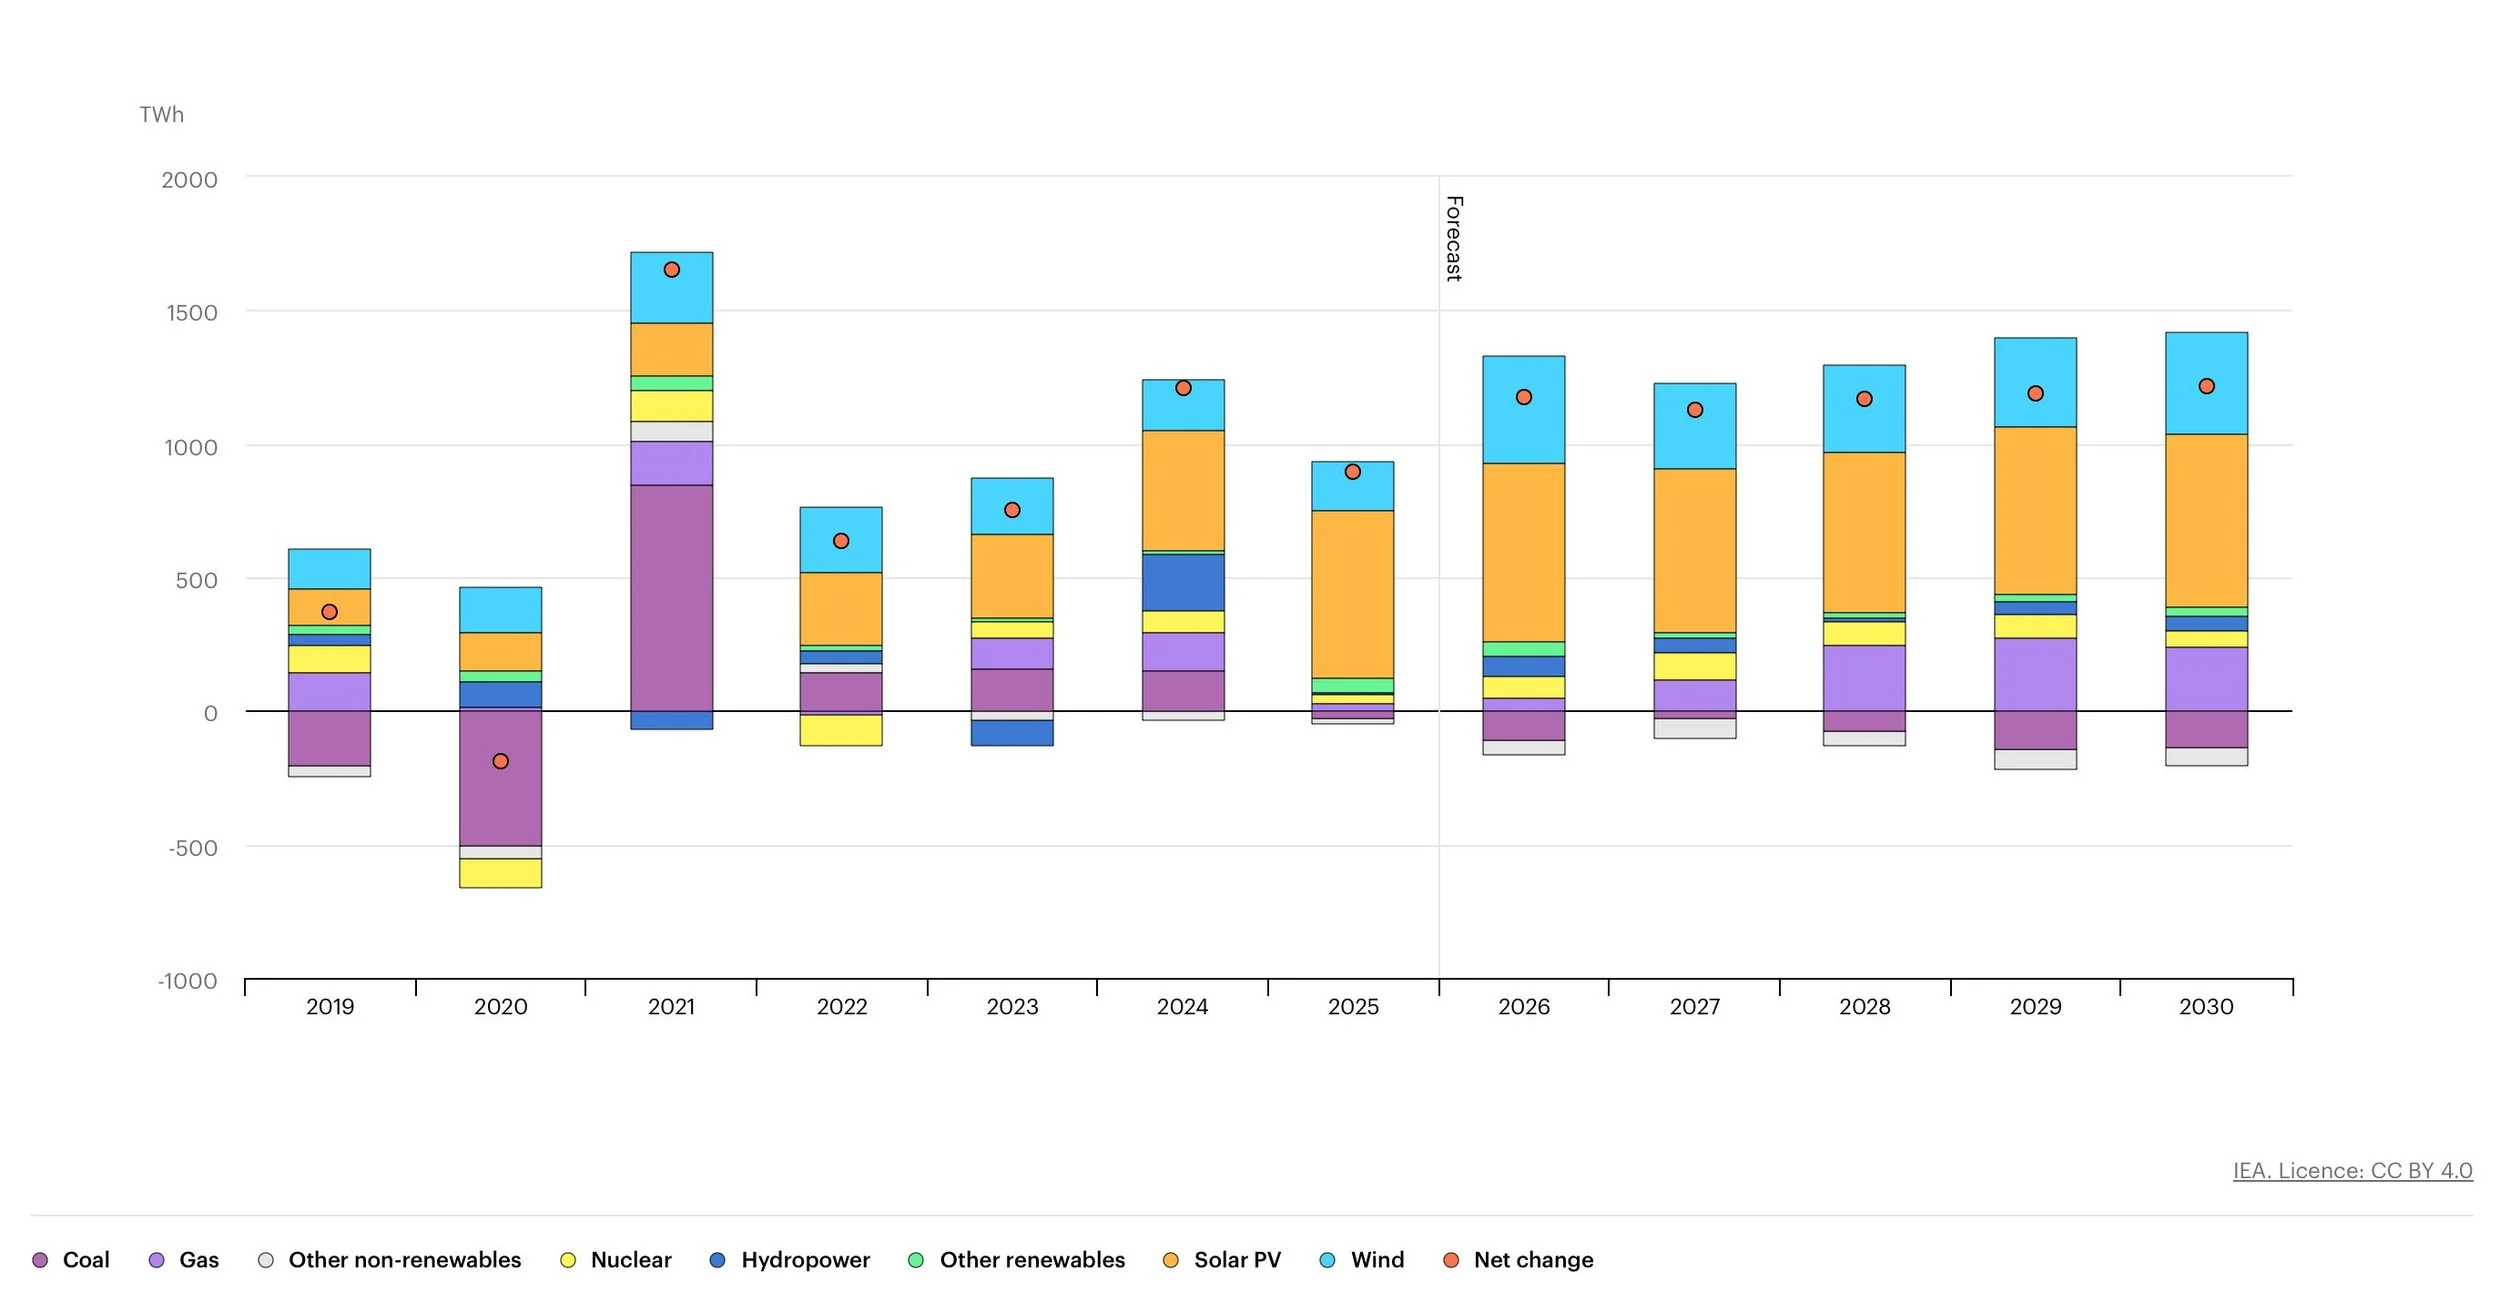
IEA Energy production by source
Their intermittency is the main limiting factor: data centers require reliable 24/7 power, so renewables are typically paired with battery storage (which is itself seeing record additions) and flexible gas peakers. The Iranian supply shock indirectly boosts renewables by elevating fossil-fuel risk premia and wholesale prices, improving project economics and dispatch priority for existing wind and solar assets. Overall, renewables are no longer a marginal supplement—they are now the default lowest-cost source for incremental electricity supply and a critical hedge against geopolitical fossil-fuel volatility.
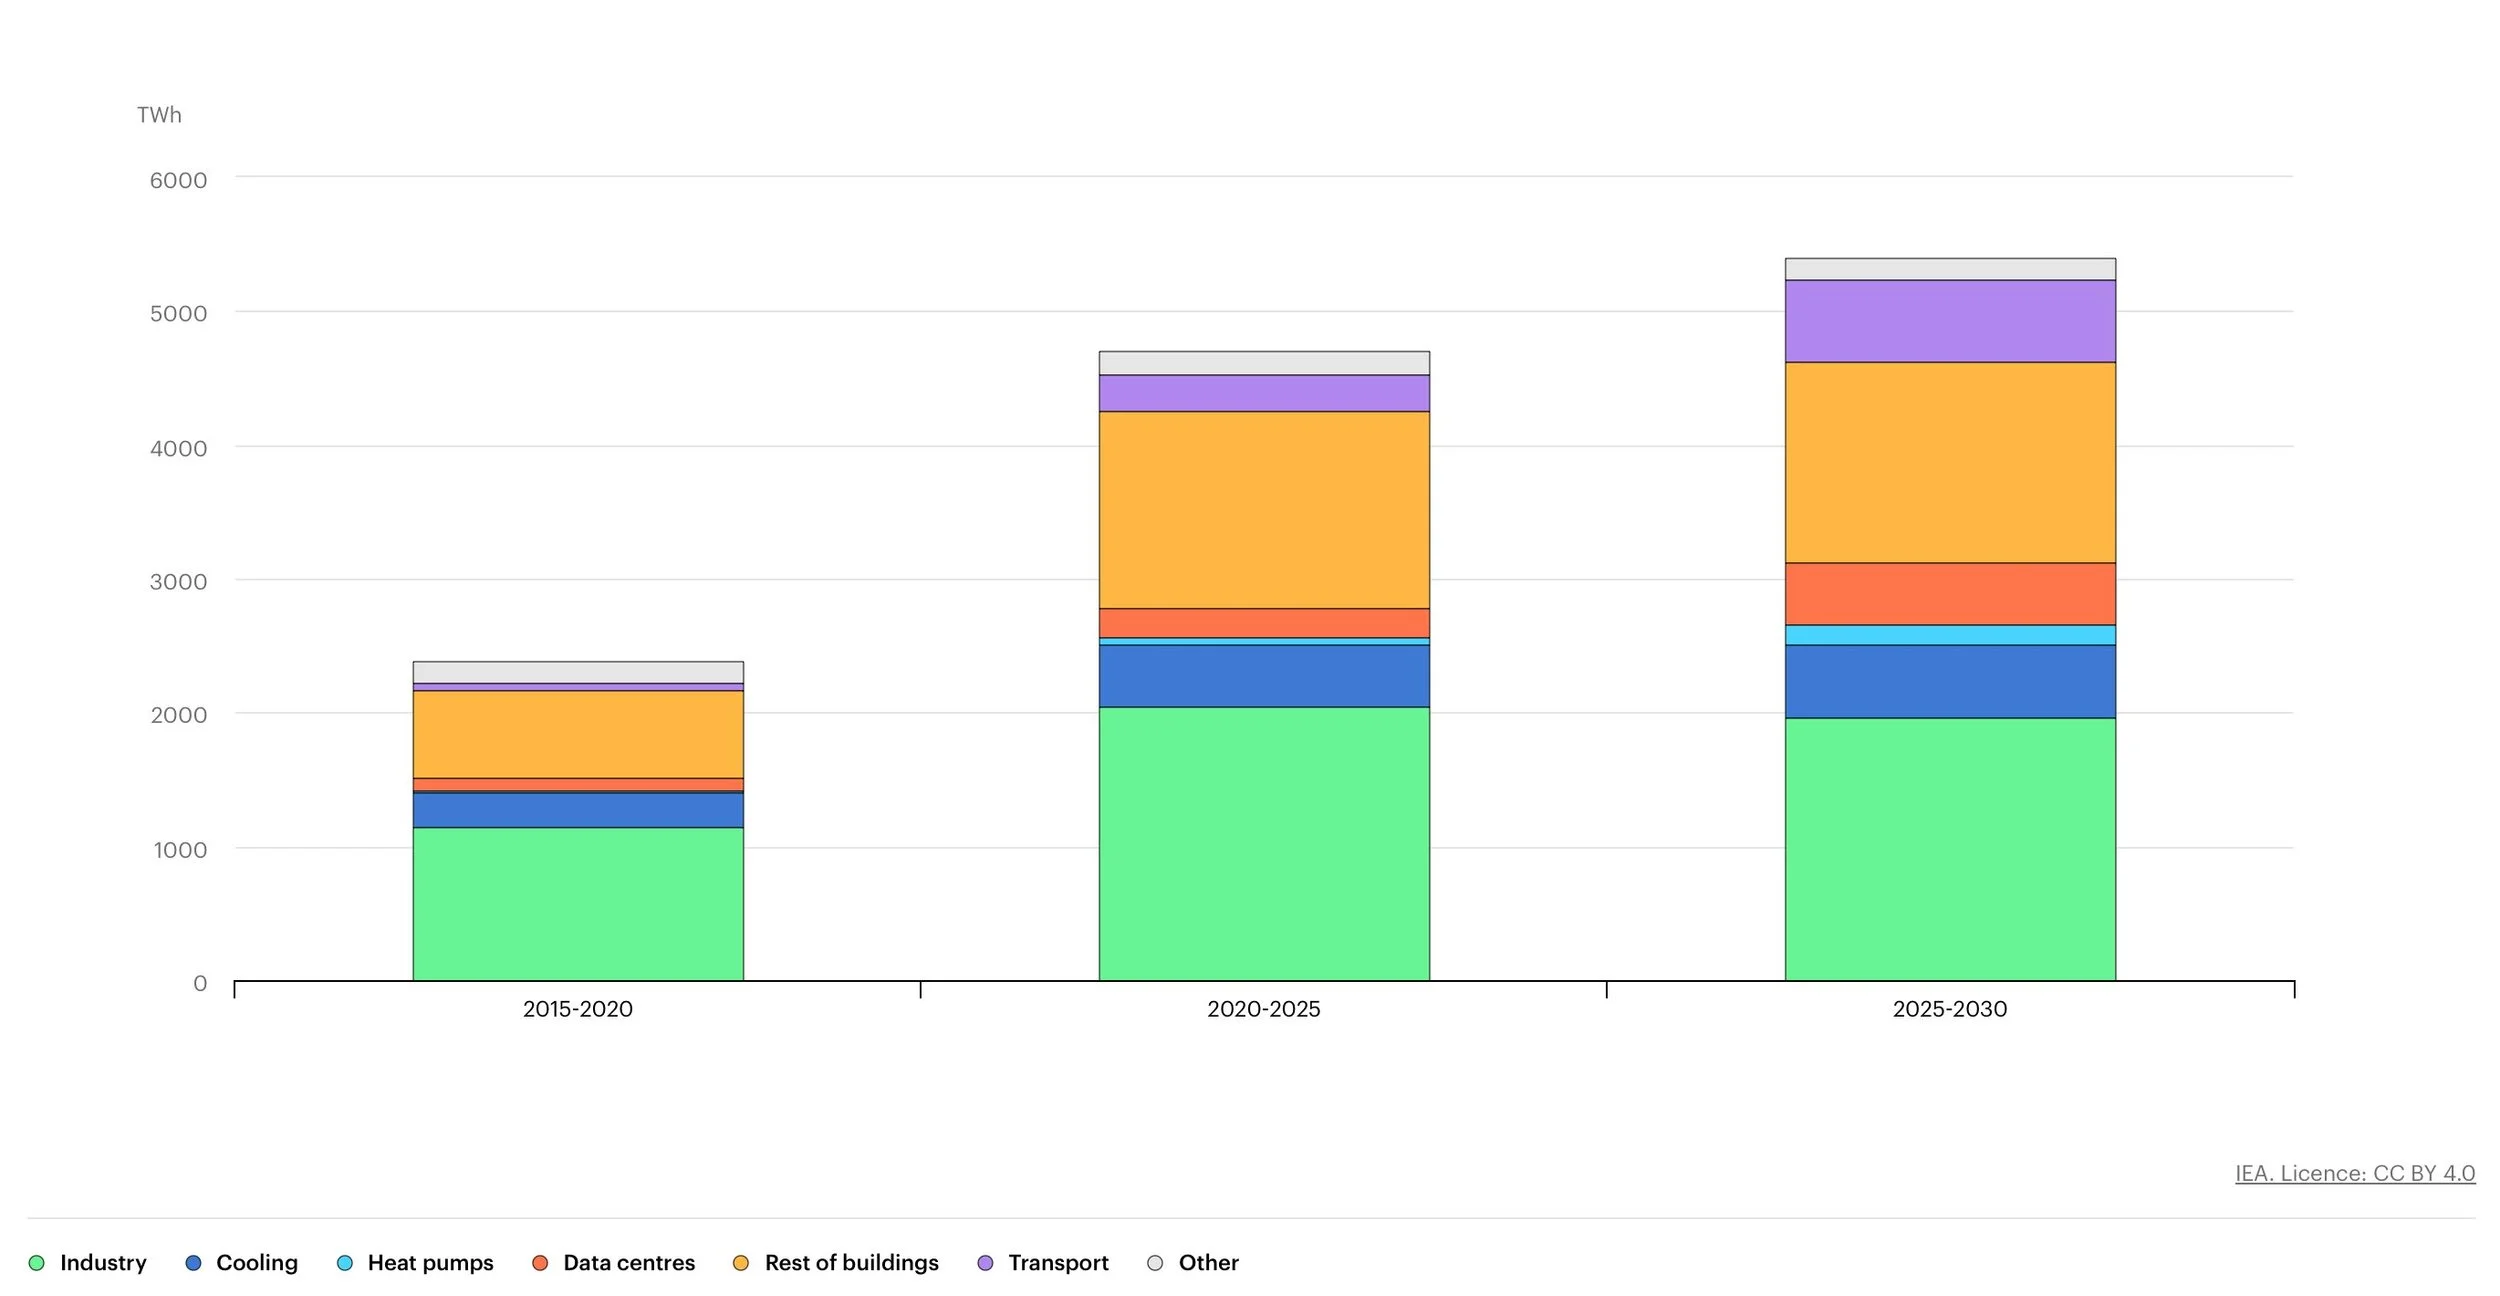
IEA Electricity usage by type
Investment Implications: Winners, Losers, and Portfolio Positioning
Upstream energy equities (majors with Middle East exposure or U.S. shale) are positioned for windfall gains from higher oil realizations and risk premium. OPEC+ spare capacity and U.S. production flexibility provide buffers, but sustained Hormuz issues could hold Brent well above $90/bbl. Refiners face mixed diesel/jet fuel margin upside. Utilities are the clearest structural play. With an estimated 7% annual capex growth through 2029, rate-base expansion, and regulated returns amid 6%+ electricity inflation. Regional differentiation matters with Midwest and Texas names facing the sharpest wholesale price upside.
Downside risks include regulatory pushback on cost allocation to data centers or prolonged outages (costing $8.4/kWh economically). Renewables developers, storage providers, and grid infrastructure companies (transformers, transmission) also benefit strongly from the flexibility needs highlighted by the IEA, with solar and battery plays particularly well-positioned for outsized returns given the record 2026 capacity additions and hyperscaler PPAs.
Broader markets face modest headwinds: 0.2 percentage points consumer spending drag in 2026–2027, larger for lower-income households and data-center-heavy regions. However AI’s productivity boost dwarfs this drag in consumer spending.
Outlook and Key Risks for Investors
Base-case assumptions see Brent easing to the mid-$60s–$70s by late 2026 as disruptions ease and inventories build (+1.9 mb/d globally). Electricity inflation decelerates in 2028 on lower gas prices. However, risks are skewed to the upside: a prolonged closure of the Strait of Hormuz, Iranian production halts, or accelerated AI capex could all exacerbate market tightness.
On the renewables side, our updated predictions show continued robust expansion with solar and wind expected to capture over 60% of incremental U.S. electricity demand growth through 2027 and battery storage deployments more than doubling in key regions to manage intermittency. By 2028 the rapid buildout should begin easing long-term wholesale price pressures and further cushion the macro economy against fossil-fuel shocks.
Investors should overweight energy names with strong free-cash-flow profiles and geographic diversification, pair utilities with data-center adjacency (e.g., hyperscalers building their own dedicated power plants or captive generation), and add dedicated exposure to renewable developers and storage technology. Hedge inflation via TIPS or short-duration bonds. Monitor Strait tanker flows, U.S./Iran communications, and capacity auction results. The next 6–12 months will separate winners in what is shaping up as the most consequential energy market reset since 2022.
In summary, the 2026 energy sector offers compelling risk/reward for disciplined capital allocators. Data centers provide secular demand tailwinds; the Iranian conflict adds near-term price volatility and geopolitical premia; and the accelerating renewable buildout supplies both a long-term supply buffer and attractive investment opportunities. The net result: higher returns for energy investors, tempered macro drag, and a powerful reminder that the energy transition and geopolitics remain inextricably linked.